
Speculative charts: unconfirmed projections
Community theories drawn on the Bitcoin chart. We collect them to show how people read cycles, not because we believe them. We have not verified these levels and do not treat them as a forecast.
What these indicators mean
TD Sequential is Tom DeMark's counter. It counts consecutive candles that close below (or above) the close four candles earlier. A count of 9 is a “buy setup” (or sell setup): a hint that a move may be running out of steam. On its own it is not a reversal signal.
50-month moving average is the average monthly close over the last 50 months (about 4 years, roughly one halving cycle). In past bear markets price came near it several times, so people call it “cycle support”.
Why such projections are unreliable. Bitcoin has only about four full cycles, far too few for statistics. Lines through bottoms are drawn after the fact, and a neat line fits almost any set of points. The market changes: ETFs, corporate treasuries and macro act differently than in 2015. A specific date and price 4–6 years out is a guess, not a calculation.
- ⚠ Theory, unconfirmed, not a forecast or investment adviceBTCUSD, MVRV momentum · chart updated 13 Oct 2026 · post 14 Oct 2026, 13:46 London
MVRV Momentum Oscillator turns green again (PlanB)
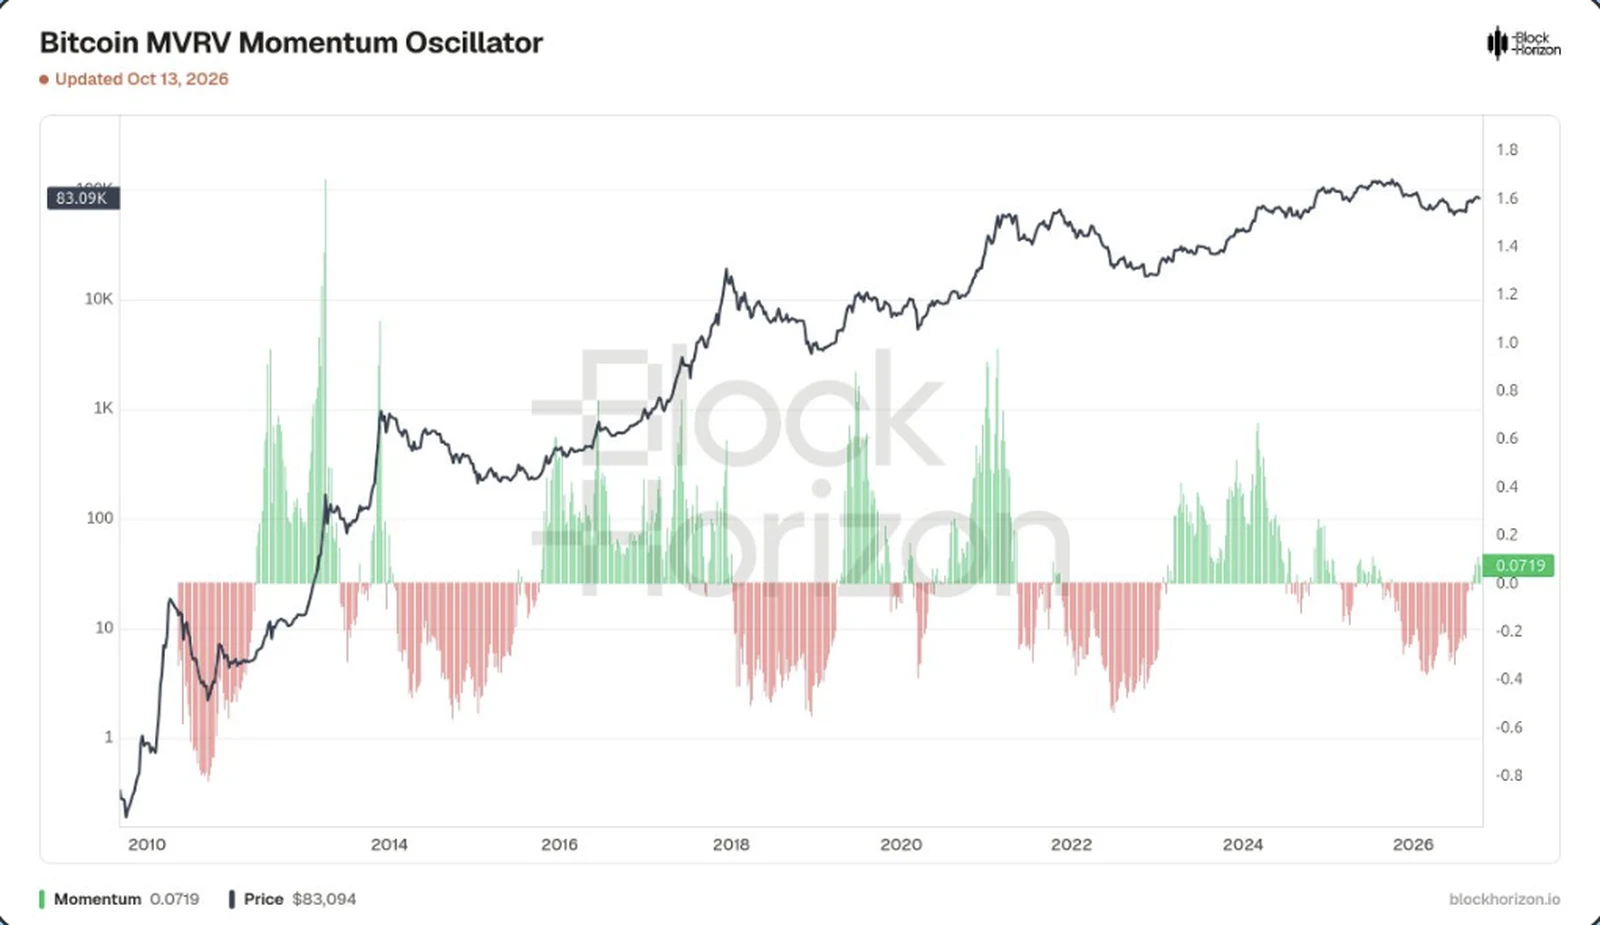
MVRV compares the Bitcoin price with the average price at which all coins last moved, roughly what holders paid on average. Momentum shows whether that ratio is speeding up or slowing down. Green bars mean holders are getting richer faster; red bars mean slower. After a long red phase through 2025–26, the oscillator has just turned green (0.0719 on 13 Oct 2026, price $83,094). In past cycles green phases came before price rises. That is what PlanB points to with his 🟢🔴🟢🔴🟢🔴🟢 post, and his line "it can't be that easy, right?" is irony: the signal looks suspiciously simple. This is an unconfirmed theory, not a forecast and not investment advice.
- MVRV = market price ÷ average price at which coins last moved
- Green = ratio rising faster (holders richer faster), red = slower
- 13 Oct 2026: momentum 0.0719 (green) after a long red 2025–26 phase; price $83,094
- Speculative: past green phases preceded rises; few cycles, no guarantee
Author: PlanB (@100trillionUSD); chart: Block Horizon (blockhorizon.io) · source · added 2026-10-14
- ⚠ Theory, unconfirmed, not a forecast or investment adviceBTCUSD, 1M (monthly)
TD Sequential buy + 50-month moving average test
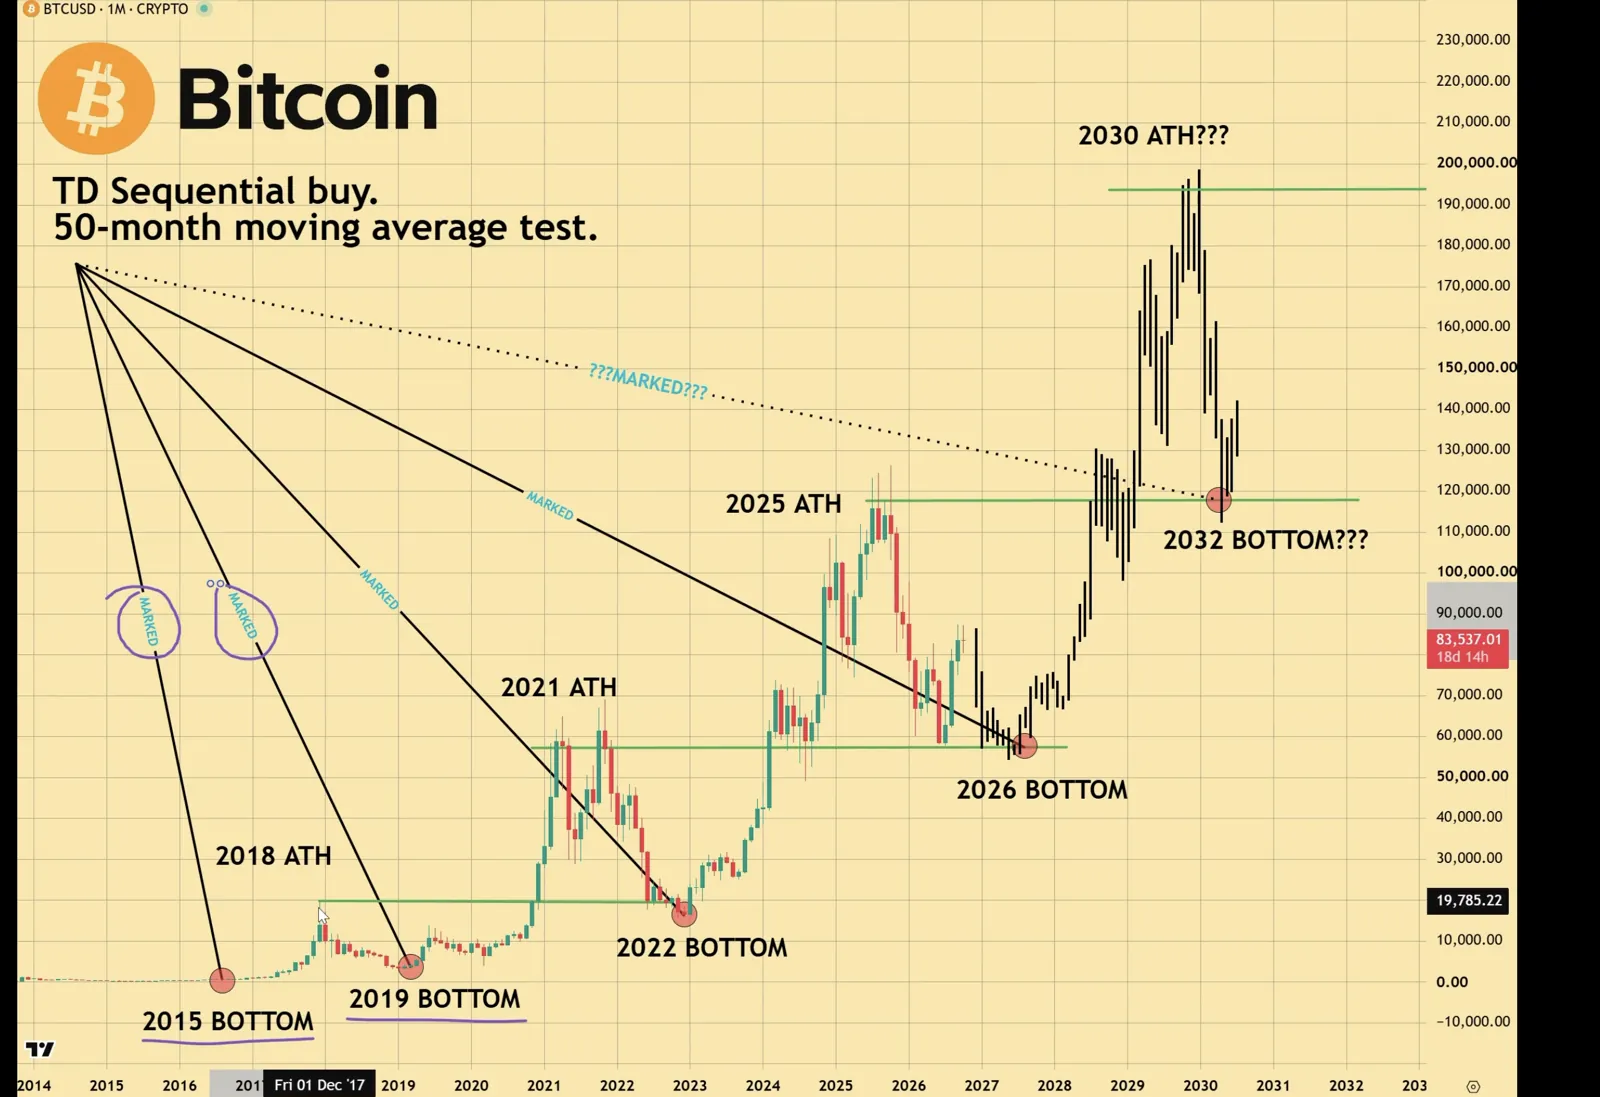
A community chart of Bitcoin on the monthly timeframe. It marks cycle bottoms in 2015, 2019, 2022 and 2026 that sit near a descending line, and all-time highs in 2018, 2021 and 2025. It then projects a 2030 ATH around $195k and a 2032 bottom around $118k, both marked with question marks by the author.
- Bottoms: 2015, 2019, 2022, 2026 (on a descending line)
- ATHs: 2018, 2021, 2025
- Speculative: 2030 ATH ~$195k
- Speculative: 2032 bottom ~$118k
Author: unknown (not attributed) · added 2026-10-14